How to access our long covid research study data

Anyone can access the Biomesight dataset and compare their own sample(s) to the cohort of their choice using the Cohort Filter.
Step 1
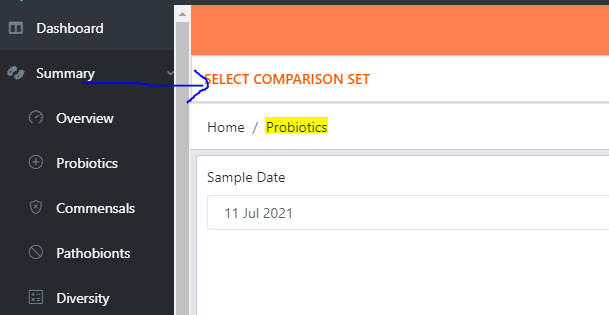
Aggregated cohort data can be accessed from any screens where community stats are shown for comparison (e.g. Those with distribution tabs or windows.) Look out for the "Select comparison Set" panel at the top of the page and expand it to refine the community selection. Please note that only users with completed health profiles can access these filters.
Step 2
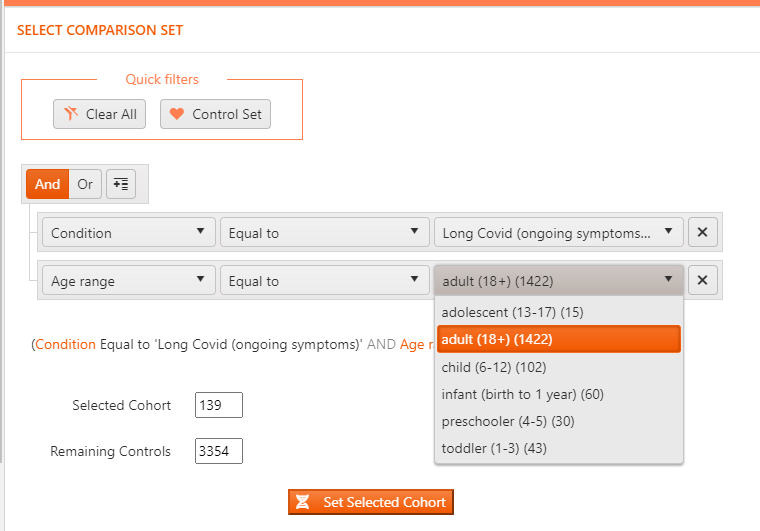
Set the filters as follows:
Set condition to Long Covid (ongoing symptoms)
This filter can be expanded on to include Age range or other criteria as shown below. Please choose between AND or OR to combine criteria.
Step 3
Note the size of the selected cohort (139) to ensure it is of sufficient size. Generally we would want to look at at least 50 samples.
Step 4
Press the "Set Selected Cohort" button and ensure the number of samples at the top of the page changes to match the filter sample number.

Step 5
You have now changed the community for which the distribution is shown everywhere in Biomesight.
Decide on which metrics you would like to compare your own sample to. Any bacteria or metabolite/enzyme/toxin or other substrate available in Biomesight can be compared by going to the distribution for that metric.
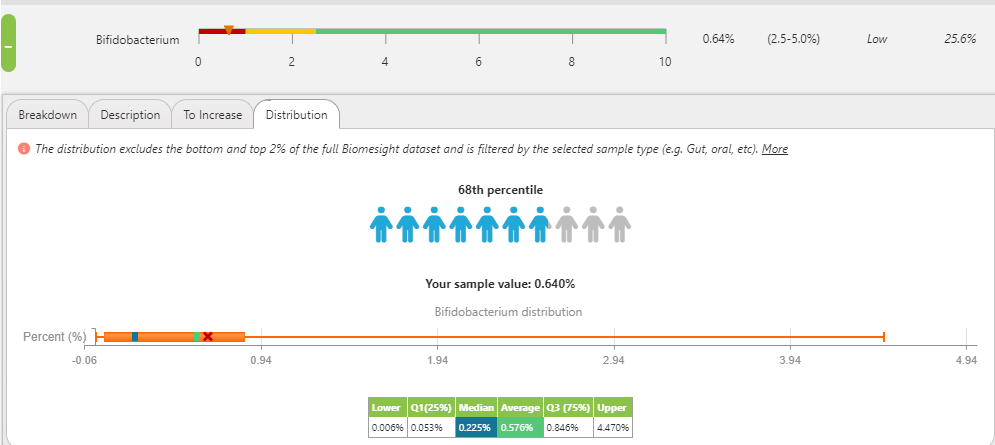
For example to compare Probiotic - Bifidobacterium . Go to the Probiotics section, select Bifidobacterium and select the distribution tab.
In the example below the distribution is shown as per the boxplot and your sample percentile is also shown. In this instance, the value of 0.640% is higher than 68% of the community and less than 32% of the community.
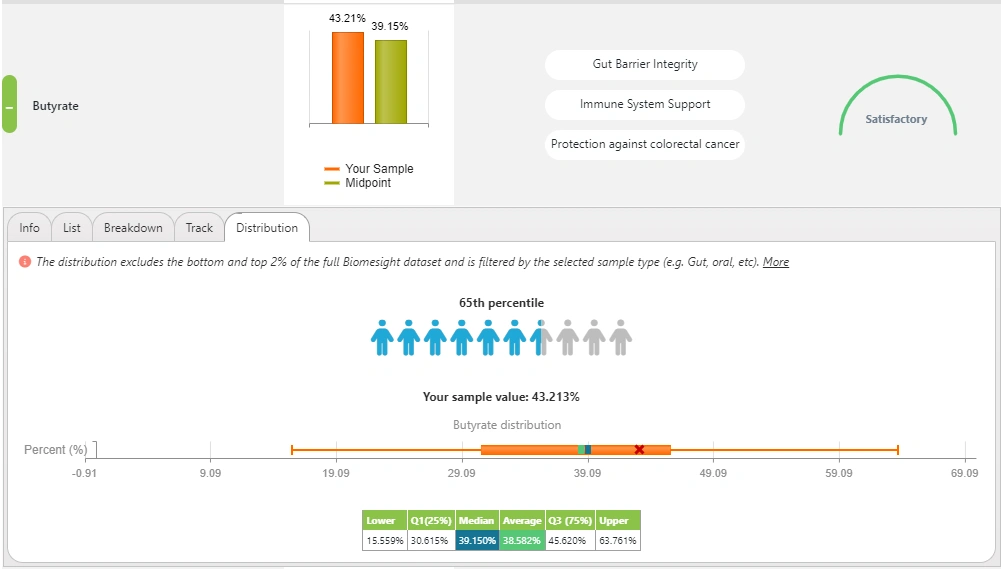
Step 6
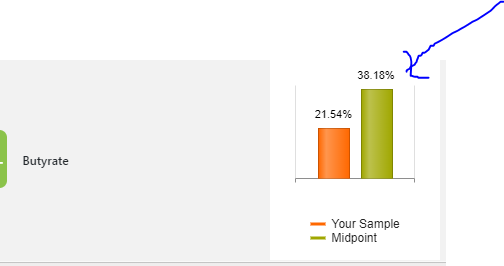
To compare Butyrate, a SCFA, go to SCFAs.
Expand the Butyrate panel. The midpoint seen here is now for the selected cohort.
Click on the distribution tab to see the full distribution and your sample percentile:
Categories: Features Long COVID Tags: features long covid