How to access the full Long-COVID Study Findings using the Cohort Analyzer
Access to the Cohort Analyzer is on request only. Please send an email to support@biomesight.com if you would like access and refer to this article for an introduction.
I have shared the version of the long-COVID model associated with our long-COVID blog update publicly.
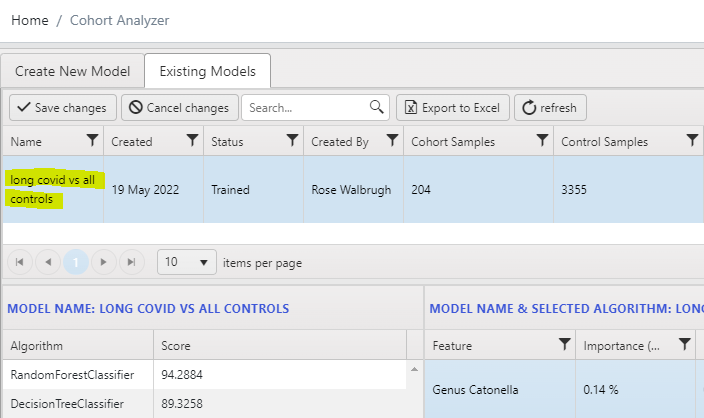
1. Once logged into Biomesight, select the Cohort Analyzer tab.
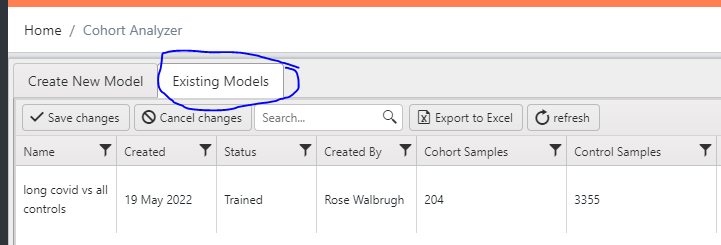
2. Select the "Existing Models" tab.
3. Search for a model created by myself, Rose Walbrugh called "Long covid vs all controls". Select the model in the grid.
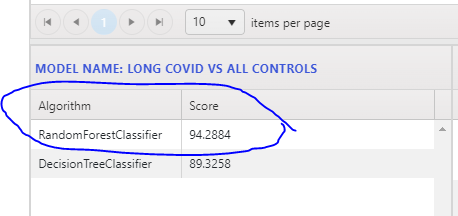
4. Select the "RandomForestClassifier" model instance
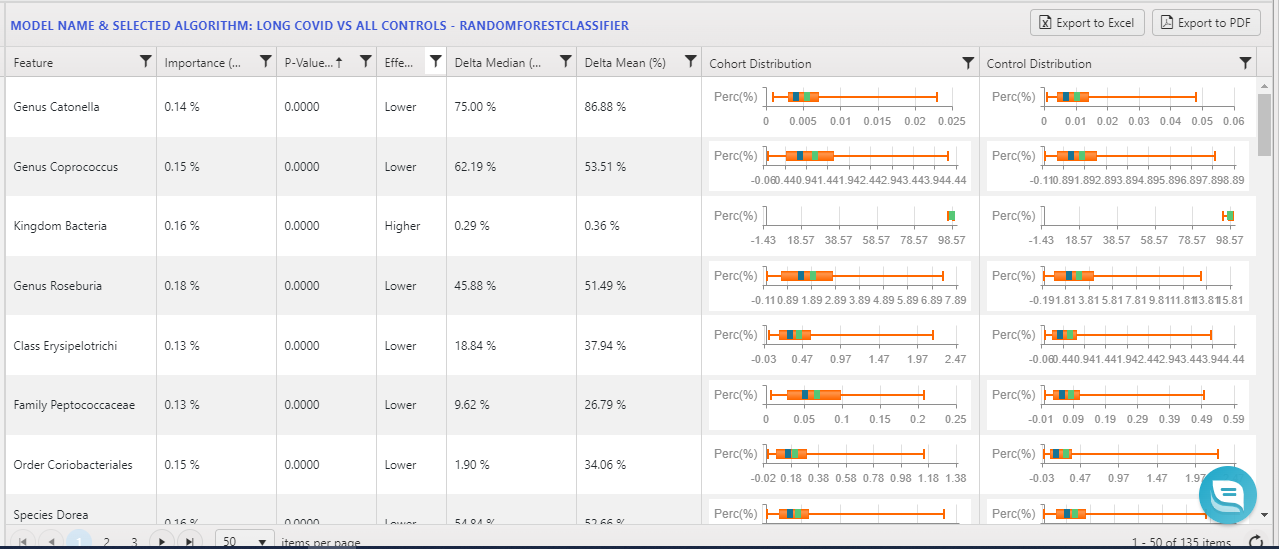
5. The findings of the model is contained in the Model Features grid.
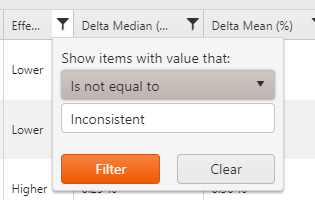
6. It would be best to exclude those with an inconsistent Effect
7. You can sort the grid as per your interest, but it would be best to disregard findings where the p-value is greater than 0.05 and the difference in median and/or median is lower than at least 5%.
8. The full distribution is illustrated in a boxplot chart in the Cohort & Control distributions columns
9. You can also click on the distributions columns to see the exact details as the distribution is not always easy to read in the boxplot above.
Please do not hesitate to reach out to support@biomesight.com if you have any questions.
Categories: cohort analyzer Long COVID Research Tags:


