
The role of inflammation from LPS in Long-COVID

A mechanism that is well studied and directly associated with the gut microbiome is LPS in the blood. This presentation by Dr Rhonda Patrick is really excellent and shows the impact of LPS on various disease states. Increasing and decreasing LPS levels have been shown to correlate with symptoms very clearly. LPS stands for Lipopolysaccharide and the only potential source for it is the cell walls of gram-negative bacteria.
This ties in with the initial findings from our long-COVID study, where the cohort has higher gram-negative bacteria (those with LPS in their cell walls) and lower butyrate-producing bacteria. Butyrate is a beneficial short chain fatty acid and feeds enterocytes which help to reduce intestinal permeability. For LPS to be a problem, there needs to be a degree of permeability (leakiness) to allow the bacteria through the walls of the gut lining.
Below are some of the key supporting statistics from our research study.
LPS/Gram-negative bacteria
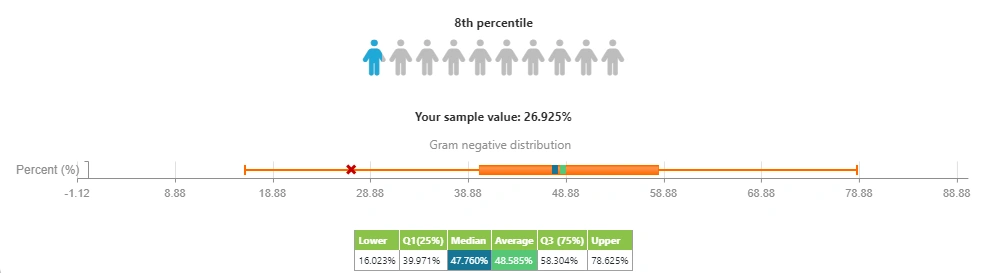
Long-covid cohort - median: 47.7%, average: 48.6% vs all samples median: 44.7%, average: 44.6%. Bear in mind that even though the Biomesight overall user base does not consist of particularly healthy controls, we still see a 10% difference.
To give some perspective, the below screenshot shows one of my own samples' LPS/Gram negative Bacteria compared to the cohort's distribution. My own sample's value (27%) at this point is representative of a more ideal ratio of gram negative/gram positive bacteria.
Lets dig in a little deeper and look at Proteobacteria. Proteobacteria is a phylum of bacteria with the most harmful LPS in their cell walls. Considering just the gram-negative formula is too simplistic, as all gram-negative bacteria are counted equally, but in reality, all LPS is not equal. Even so, the correlation continues:
Cohort - median: 3.7%, average: 4.6%
All samples - median: 3.4%, average: 4.25%
The 10% difference is maintained here.
Butyrate
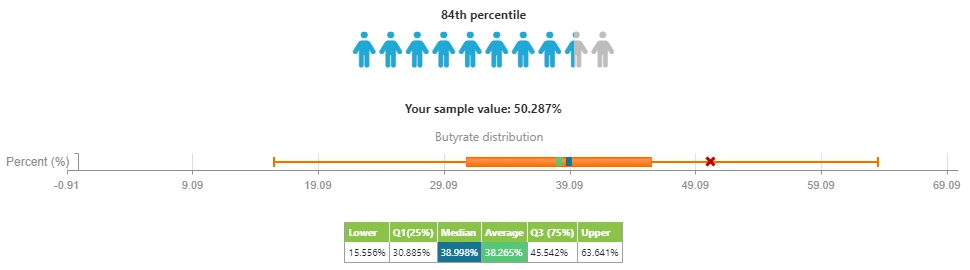
The same comparison for butyrate producers - the target for sufficient butyrate producers according to Dr Jason Hawrelak is 40%. Here we see just a very slight reduction in butyrate producers across our cohort.
Cohort - median: 39%, average:38.3%
All samples - median: 40.8%, average: 40.4%
The screenshot shows the x as again one of my own samples, as is indicative of a level for butyrate producers that is more ideal, compared to the long-covid cohort. We frequently see healthy young people with butyrate-producers over 50%.
If you'd like to explore the long-covid dataset yourself, please refer to the article on how to use the screen cohort filters.
Categories: Tags: featured long covid