
How we calculate microbiome diversity in Biomesight

Many people would assume that diversity is simply an indication of the variety of bacteria in their guts, and therefore the higher the number of different organisms, the higher the diversity.
While the number of different organisms definitely factor into the equation, there are other factors which weigh in also:
- Evenness of the distribution
- The overall taxonomy of the organism
Why does this matter? Lets illustrate with an example.
A. Lets say we have a community of 1000 organisms, of 5 different species, each representing 200 organisms and therefore 20% each.
B. Lets say we have a community of 1000 organisms, of 5 different species, one species have 996 organisms, while we have only 1 member of each of the other species.
Which of these two communities are more diverse? Instinctively we sense that community A is more diverse. While B has the same species present they are a minority species and therefore harder for them to survive and thrive. This is why the evenness of the distibution factors into the diversity calculation.
The next aspect not commonly considered is the taxonomy. The reason we factor in both, is because taxonomy is also relevant as an indication of real diversity.
Again 2 examples:
A. 1000 organisms, 5 genus, 5 species within each genus, with a total of 25 species. Each species is present in equal proportions.
B. 1000 organisms, 1 genus, 25 species within the genus. Each species is present in equal proportions.
Again we instinctively know that community A is more diverse even though both have the same evenness distribution at the species level.
Biomesight uses the Shannon-Wiener diversity index for the above calculation. This is a standard measure of diversity which factors in both evenness and overall number of different organisms.
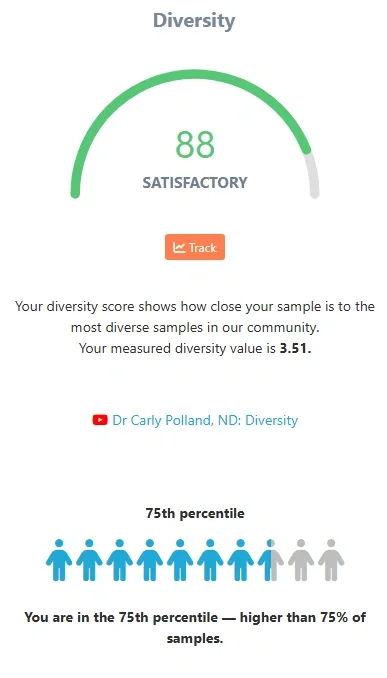
For those of you that might be familiar with what Shannon index numbers normally look like - you will see this number only within the boxplot chart, which illustrates where the sample fits into the overall Biomesight database.
In this example, the diversity is at the upper end of average - at the 75th percentile. By default this is compared to all other samples in Biomesight of the same sample type as the sample under review. We segregate sample sets by sample type as typically the vaginal or oral microbiome will be much less diverse than a typical gut microbiome.
If you were to change the comparison set, your percentile value would be shown relative to the selected community.
Furthermore, we convert the the figure into a percentage value scored out of 100, to make it easier to interpret and utilize in the overall score. Those within the top 1% percentile of all samples, will score 100. The rest will see the score as a percentage of the 1% percentile target.
Lastly, is higher diversity always better? No, diversity is simply one measure which is why it factors into our gut health score but does not dominate the score as it weights in at 20% of the overall gut score. Additionally, some research studies are finding there to be a middle zone of "optimal" diversity, meaning that more diverse is not always better.
Note that our scoring system and calculations and constantly under review and we will keep this article updated on the latest factors weighing into the calculation.
Last updated: 8 October 2025
Diversity calculation changes released on 8 October 2025:
-
No longer segregated by lab:
We now calculate a depth-adjusted percentile, removing the need to separate data by lab. This change was introduced after median sequencing depth increased from ~40k to ~100k paired reads (with some samples reaching over 1.1 million paired reads) following our move to the new lab in Cordova, TN. The new lab uses an Illumina NextSeq 2000 rather than the previous Illumina MiSeq, which produces significantly more reads. -
Top 1% percentile target:
The diversity score is now benchmarked against the top 1% rather than the top 5%. This allows users already in the top 5% to see meaningful increases or decreases over time, instead of always scoring 100%. -
New visualization:
The boxplot showing Shannon index distributions has been replaced with the community percentile chart used elsewhere in Biomesight. This makes results easier to interpret and avoids misleading comparisons of Shannon distributions over time, since sequencing depth now differs substantially between the previous and current laboratories.
Categories: Diversity Tags: calculation diversity health immune system