Feature update: Biomesight distribution vs ideal ranges

In recent weeks we have released a new distribution feature. I thought it would be easiest to illustrate this through the short walkthrough video below.
Highlights of the video
- How to access the distribution ranges - either from the overview sub-sections or the Advanced Results - Detailed View sections.
- How the Biomesight distribution compares to the optimal ranges used for the scoring system
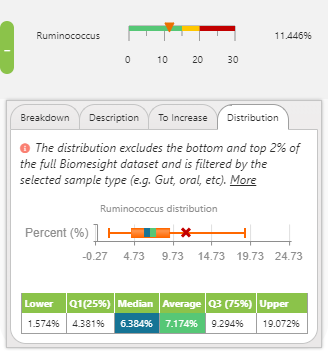
- The meaning of each of the points on the boxplot
- How to identify your microbiome outliers
The next step now that we have added the distributions is to add screen filters, allowing users to choose which samples to include in the dataset they are comparing their sample against. E.g. others with a similar health condition, on the same medication or those with the same symptoms. Similarly, users might also want to compare against those in very good health.
As our dataset grows and sample meta data becomes more rich, we also anticipate eventually updating our optimal ranges and possibly allowing for more complex interpretations and scoring systems. An example of this is when low Akkermansia is accompanied by abundant levels of Faecalibacterium. Both are strongly correlated with the health of the gut lining. In this case, will there definitely still be a benefit in increasing Akkermansia? This is one of the many questions we are looking forward to answering over time.
To make these meaningful, we heavily rely on everyone completing their health profiles as comprehensively as possible and keeping these up to date over time, especially each time new samples are added.